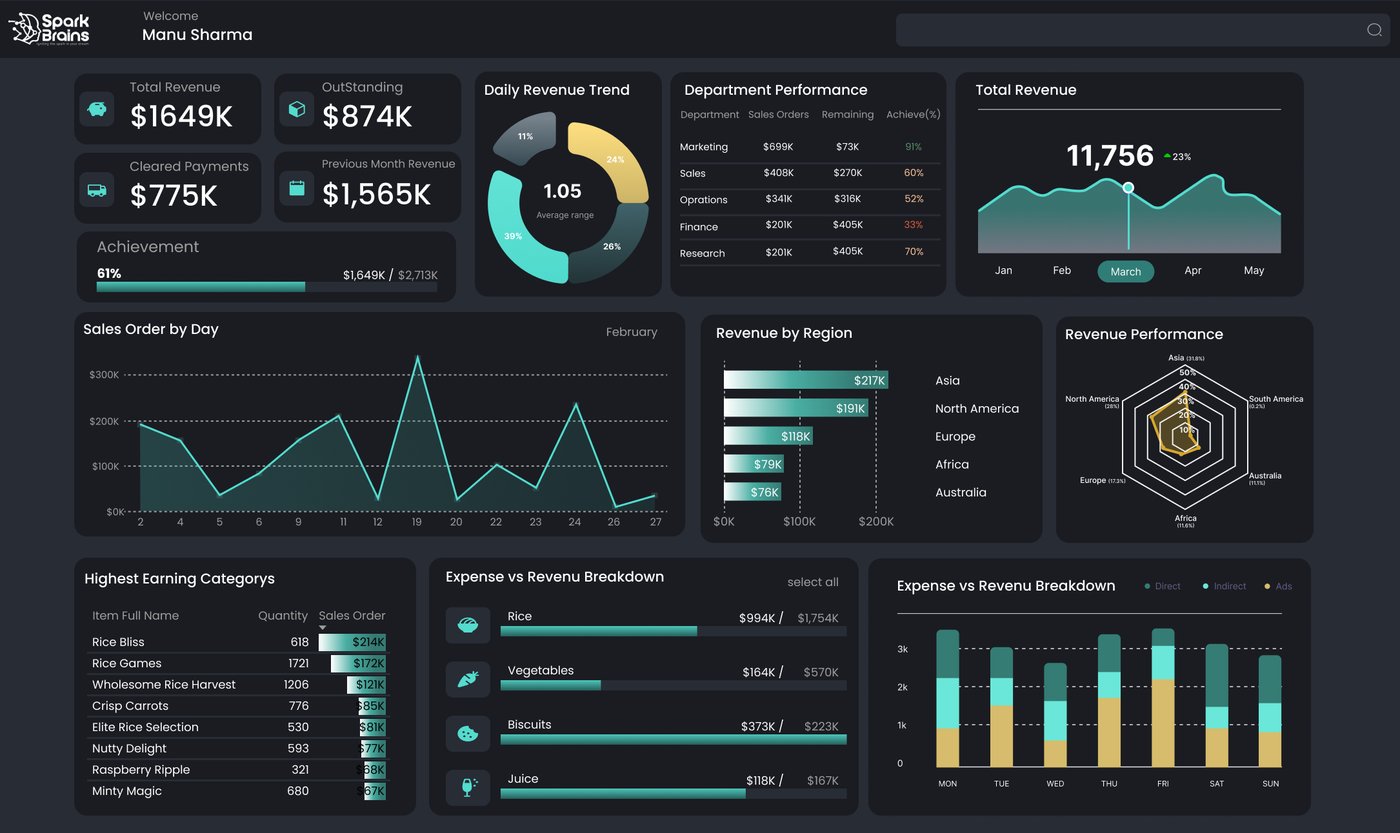
In a rapidly evolving business landscape, financial analysis is crucial for organizations to sustain profitability, manage costs, and make strategic decisions. The Power BI Financial Dashboard provides a centralized, interactive, and real-time reporting system that enables financial analysts to monitor key financial metrics effectively. By integrating multiple financial data sources, automating updates, and leveraging advanced analytics, businesses can streamline reporting processes, track revenue growth, analyze profit and loss statements, and optimize cash flow management.

The Power BI Financial Dashboard consolidates financial data from multiple sources, including SQL databases, ERP systems, accounting software (QuickBooks, Xero, Sage), and banking APIs. This seamless integration ensures real-time monitoring of revenue, expenses, profit and loss, and cash flow management. By automating data collection and processing, businesses gain a holistic view of their financial health.
Organizations often struggle with fragmented financial data, manual reporting inefficiencies, and real-time tracking limitations. This dashboard addresses these challenges by standardizing financial data, automating transformations, and enabling interactive financial reporting.
With built-in KPI calculations, the dashboard delivers critical financial insights such as Net Profit Margin, Return on Assets (ROA), Debt-to-Equity Ratio, and Working Capital. AI-powered forecasting helps businesses anticipate revenue trends and optimize budgeting decisions.
Ensuring the security of financial data is paramount. The dashboard incorporates encryption, role-based access control, and compliance adherence with financial regulations. Automated data governance mechanisms safeguard sensitive financial information while maintaining transparency.
Financial reporting is no longer confined to static spreadsheets and manual calculations. The Power BI dashboard leverages dynamic visualization techniques to present financial data in an engaging and easy-to-interpret format.
With real-time updates and interactive filters, financial analysts and executives can drill down into key metrics, compare trends, and uncover actionable insights. This intuitive interface ensures informed decision-making and efficient financial planning.
“The Power BI Financial Dashboard is more than just a reporting tool—it’s a game-changer. By transforming complex financial data into actionable insights, it empowers businesses to optimize costs, drive profitability, and make informed financial decisions with confidence.” — Gaurav Dhiman, Data Scientist
Designed for financial analysts and business executives, the Power BI Financial Dashboard offers an intuitive user experience.
Users can navigate effortlessly through real-time reports, filter financial metrics dynamically, and drill down into detailed financial data. The platform ensures consistent accessibility across devices, enabling decision-makers to analyze financial health anywhere, anytime.
Overview
In a rapidly evolving business landscape, financial analysis is crucial for organizations to sustain profitability, manage costs, and make strategic decisions. The Power BI Financial Dashboard provides a centralized, interactive, and real-time reporting system that enables financial analysts to monitor key financial metrics effectively. By integrating multiple financial data sources, automating updates, and leveraging advanced analytics, businesses can streamline reporting processes, track revenue growth, analyze profit and loss statements, and optimize cash flow management.
Challenges
Solution
The Power BI Financial Dashboard addresses these challenges by integrating structured financial data, automating transformations, and delivering interactive reports. The solution involves:
Implementation Process
1. Data Insertion in Power BI
To build a comprehensive financial dashboard, data is integrated from multiple sources:
2. Data Cleaning & Transformation (Power Query Editor)
Financial data often contains inconsistencies, requiring structured cleaning:
3. Creating the Financial Dashboard
The dashboard is designed to provide an interactive financial overview, incorporating:
4. Real-time Data Updates & Automation
Power BI ensures continuous data accuracy with:
5. Business Impact & Insights
By leveraging the Power BI Financial Dashboard, organizations achieve:
Conclusion
The Power BI Financial Dashboard revolutionizes financial reporting by integrating data from multiple sources, automating processing, and delivering real-time insights. This solution enhances financial visibility, streamlines reporting workflows, supports informed decision-making, empowering organizations to maintain financial stability and drive business growth.