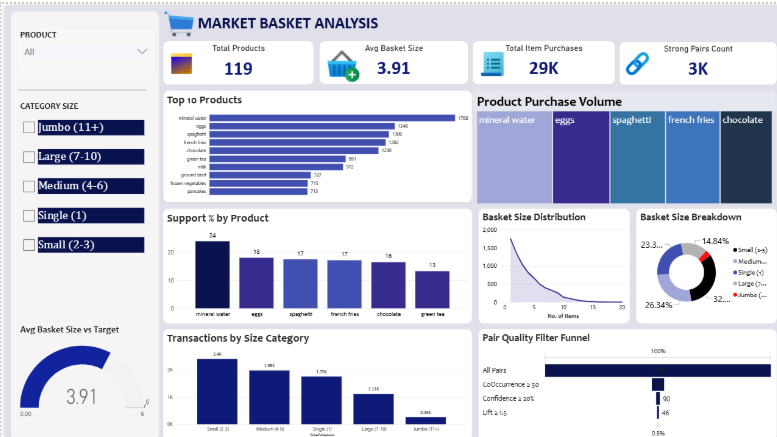
This dashboard suite applies association rule mining to grocery transaction data to uncover which products customers buy together and how strongly those relationships hold. Spanning two connected report pages — Market Basket Analysis and Product Association Deep Dive, it analyses 119 products across roughly 29K item purchases to surface frequently paired products, basket-size patterns, and statistically validated product relationships using Support, Confidence, and Lift metrics. The result is a data-backed foundation for cross-sell recommendations, product placement, and bundling strategy.
Transaction data existed only as raw item-level purchase records, with no visibility into which products were actually bought together or how reliable those pairings were. The business had no way to distinguish a genuinely strong product association from pure coincidence, making cross-sell and shelf-placement decisions largely guesswork.
Raw transactions were cleaned and restructured in Power Query into item-pair combinations, then modelled to calculate Support %, Confidence (both directions), and Lift for every product pair. These core association measures were built once in DAX and reused across both report pages, so a "strong pair" on one page means exactly the same thing on the other.
Beyond simple co-occurrence counts, the model layers in bidirectional Confidence scoring, a Support-vs-Lift scatter to separate popular pairs from truly associated ones, and a Pair Quality Filter Funnel that progressively narrows 100% of all pairs down to the 0.8% that clear Co-occurrence, Confidence, and Lift thresholds simultaneously isolating only the highest-quality, actionable pairs.
Thresholds for "Strong," "Moderate," and "Weak/No Association" categories were tuned iteratively against the Lift distribution, and basket-size segmentation (Single, Small, Medium, Large, Jumbo) was added to check whether associations held consistently across different basket sizes refining which pairs were flagged as genuinely reliable versus incidental.
“A pair of products showing up together often isn't the same as those products being genuinely associated, Lift is what tells you whether you're looking at a real pattern or just popularity.” — Tamanna Thakur, Data Analyst
Enhancing Accuracy in Product Association & Basket Composition Tracking
The dashboard suite combines transaction-level basket metrics with pairwise association statistics into one governed model, so every relationship — from a simple co-occurrence count to a directional Confidence score — is calculated consistently and can be trusted for merchandising decisions.
What started as raw transaction logs has become a rigorous, statistically grounded view of how products relate to one another, one that's ready to power real-time recommendations, not just retrospective reports.